The AI Agent Metrics That Actually Matter: Beyond Tokens and Latency

Based on an interview with AI Inference Researcher Yuyang Huang on what agent developers should actually be measuring.
Tensormesh is an AI inference optimization company that never charges you twice for cached tokens, making AI applications faster and dramatically cheaper to run anywhere.
A scene every agent developer has lived through
A user pings you on Slack to say your agent feels sluggish today. You pull up the trace in LangSmith (or Langfuse, or whatever you happen to be using) and find that every individual LLM call is well under a second. Tokens-per-second is healthy, your provider's status page is green, the latency dashboard your platform team is so proud of is showing a flat line, and you still cannot figure out where the time is actually going.
You scroll through the trace and eventually find your answer. There are nine LLM calls in this run, where the first three are the planner deciding what to do, the next four are tool calls and the model reasoning about their results, and only the last two produce anything the user can see. Between when the user hit send and when the UI showed anything other than a spinner, your agent burned eighteen seconds.
None of your dashboards were measuring that eighteen seconds, because they were measuring individual LLM calls, which is the wrong unit of measurement for the system you are actually shipping.

The metrics most observability tools give you were built for chat
If you have looked at the metrics page of any of the major LLM observability tools recently, you have seen the same set of charts with tokens per call, latency per call, cost per call, requests per minute, model error rate. These metrics are clean, they make beautiful dashboards, and they were all built in the chat era when "one LLM call equals one user-visible response" was a safe assumption to make.
Agent workloads have quietly invalidated that assumption. A single user request now triggers a planner step, multiple tool calls, intermediate reasoning across several model invocations, and finally a user-facing answer that arrives somewhere near the end of the trace. The individual LLM calls inside that flow are no longer the unit your users are experiencing, which means the per-call metrics on your dashboard are no longer the metrics that predict whether your users will be happy.
The four metrics that actually predict whether your agent is performing
Here is what belongs on the main dashboard instead, with the per-call charts moved to a debugging tab where they actually belong.
Task completion accuracy – This is the most important number on the list by a wide margin, because a slow agent that finishes the task correctly will always beat a fast agent that gives up halfway, calls the wrong tool, or returns a confidently wrong answer. The mistake most teams make is grading individual LLM calls in isolation rather than grading the final output of the full trace, which means the eval suite ends up rewarding behavior that looks plausible step by step while quietly missing trajectories that completely fail at the task level. If your eval harness does not grade entire runs end-to-end against a clear notion of "did the agent do what the user asked," it is not really telling you whether the agent works in production.
Time to first subtask – Time to first token is the wrong latency metric for an agent, because the first token in an agentic trace is almost always something the user will never see, like the opening of a planner's chain of thought. The latency that actually matters is the time between when the user hits send and when the UI shows them something concrete is happening, whether that something reads "Searching the web," "Reading three files," or "Drafting an outline." This is the number your users are reacting to when they tell you the agent "feels slow."
End-to-end completion time and quality, tracked together – Teams that treat these as two separate dashboards almost always end up shipping an agent that finishes 40 percent faster and 30 percent worse, because optimizing for one of them in isolation will silently regress the other every time. They are not really two metrics so much as one metric with two axes that have to be looked at together on every release.
Cost per task, not cost per call – Your provider's billing dashboard will show you cost per request, which becomes nearly useless the moment you start running multi-step agents that make dozens of calls per user request. The number that actually matters is what each completed task costs in total, including the retries, the failed tool calls, and the planner second-guessing itself across multiple turns. Teams are routinely shocked when they sum this up for the first time, because per-call charts hide the fact that a single non-trivial run on a frontier model can easily land in the dollar-plus range, which is a very different conversation than the per-call cost suggested.
Why the new model release is making your agent worse
There is a particular pattern most agent developers have lived through in the past year that is worth naming explicitly. A new frontier model drops, the leaderboards rearrange themselves, the discourse declares state of the art, your team swaps it into the agent, and somehow the production numbers get worse. The benchmark moved up while the actual outcome moved down, which feels confusing until you understand the structural reason behind it.
The teams building foundation models and the teams building agent applications are aligned to fundamentally different reward signals. Post-training alignment runs on a limited sample of tasks, which by its nature cannot span the long tail of real agent workflows like tool-calling chains, multi-document research, code-edit-test loops, planner and executor handoffs, and reasoning sustained over hours of accumulated context. The model that wins on a public benchmark is the model that has been optimized for benchmark-shaped problems, which are not the same shape as the problems your specific agent is actually solving in production.
The fix is not to ignore model releases or pretend the leaderboards do not exist. The fix is to stop treating those leaderboards as a proxy for your own eval suite, because they were never going to be one. Run your own evals on every model swap, weigh them toward the kinds of trajectories your agent actually produces in production, and trust those numbers over whatever the discourse is excited about this week.
What this means for the inference layer underneath your agent
Getting the metrics right only gets you halfway, because once you start tracking the right numbers, you discover that the levers you need to actually move them often live below the abstraction your framework exposes, down in the inference layer that LangGraph or CrewAI or your own scaffolding is calling on your behalf.
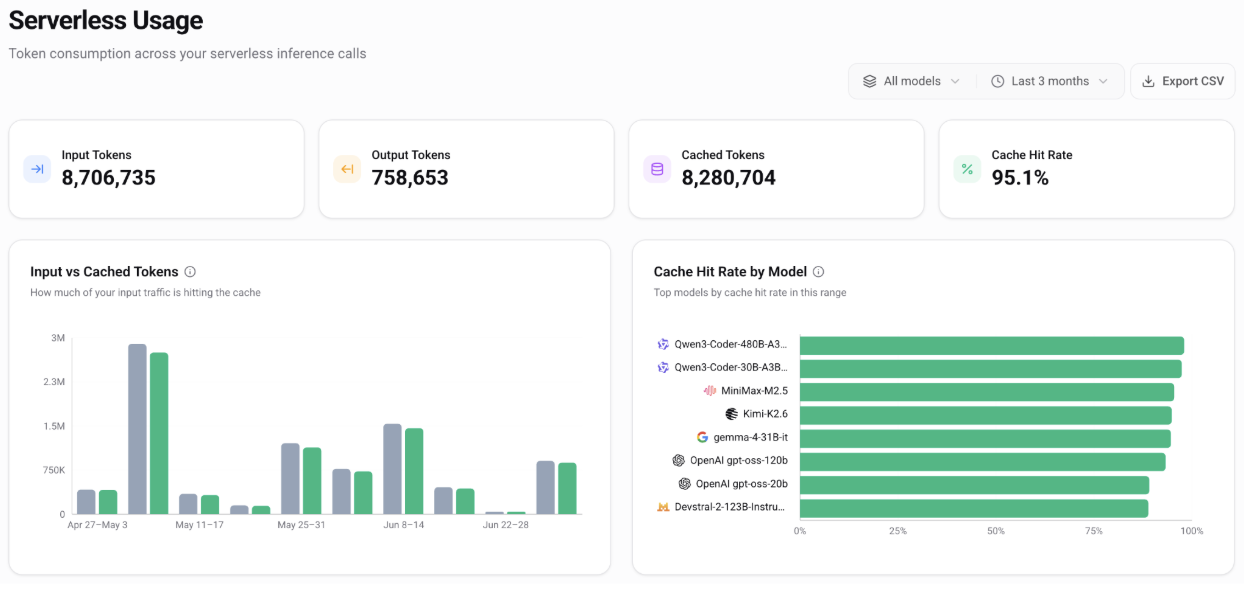
Cost per task, for instance, is dominated by how much of your prompt the underlying system has to actually re-process on each call versus how much of it can be reused from previous calls in the same trace or previous sessions with the same user. Time to first subtask is dominated by how quickly that underlying system can start producing output on the very first LLM call, which depends on how the inference layer handles your system prompt, your tool catalog, and your steadily growing conversation history.
If you are calling a closed-source API, you have almost no visibility into any of this, and almost no control over it either. The platform decides what gets reused, when it gets reused, and whether any of it survives between sessions, while your only real signal is whether the monthly bill went up or down.
This is the gap Tensormesh was built to close, by giving self-hosted agent platforms real, programmable controls over how much of each request can be reused, how long it stays warm in memory, and how those savings show up directly in your cost-per-task numbers. The agent platforms that win the next few years will be the ones whose teams figured out that the inference layer is not actually a commodity, and either built or chose one that is genuinely optimized for the workloads they are running.
The takeaway for agent developers
Stop measuring what is easy to measure, and start measuring what your users are actually paying you for. Task completion accuracy, time to first subtask, end-to-end speed and quality tracked together, and cost per task are the four numbers that will tell you whether your agent is any good, while everything else on your dashboard is a debugging tool dressed up as a key performance indicator.
In the chat era, you could get away with per-call metrics because chat really was one call per response. In the agentic era, your users are reacting to entire traces while your dashboards are still reporting on individual calls, which is exactly how teams end up shipping agents that look perfectly healthy on every chart and feel obviously broken to anyone actually using them.
Try Tensormesh
- Try Tensormesh with $100 in GPU credit.
- Integrate and deploy by plugging into your existing framework in minutes.
- Scale smarter while watching latency drop and savings stack up.